Business Modelling with Excel, Forecast pro XE and Microfit 5.0
|
Experts in :
Business Modelling Market Modelling Capital Investment projects Business Valuations Equity Debt or Bond Options New Business / New Product Assessment Financial Modelling Business Plans Cash Flow Modeling Scenario Modeling VAR - value at risk modeling For forecasting and business modelling we like to use of Excel, Forecast pro and Microfit 5.0. A great software suite to help with business, financial or economics modelling. |
Microfit 5.0 is an interactive, menu-driven program with a host of facilities for estimating, hypothesis testing, forecasting, data processing, file management, and graphic display. The features make Microfit 5.0 one of the most powerful menu-driven time-series econometric packages currently available. It is a major advance over Microfit 4.0 and offers a unique built-in interactive, searchable econometric text. It provides users with technical, functional and tutorial help throughout the package, and can be used at different levels of technical sophistication.
Microfit 5.0 - for experienced users of econometric programs, it offers a variety of univariate methods, multivariate techniques for co-integration, principal components, canonical correlations and multivariate volatility modelling, and provides a large number of diagnostic and non-nested tests. The interaction of excellent graphics and estimation capabilities in Microfit 5.0 allows important econometric research to be carried out in a matter of days.
Forecast Pro XE
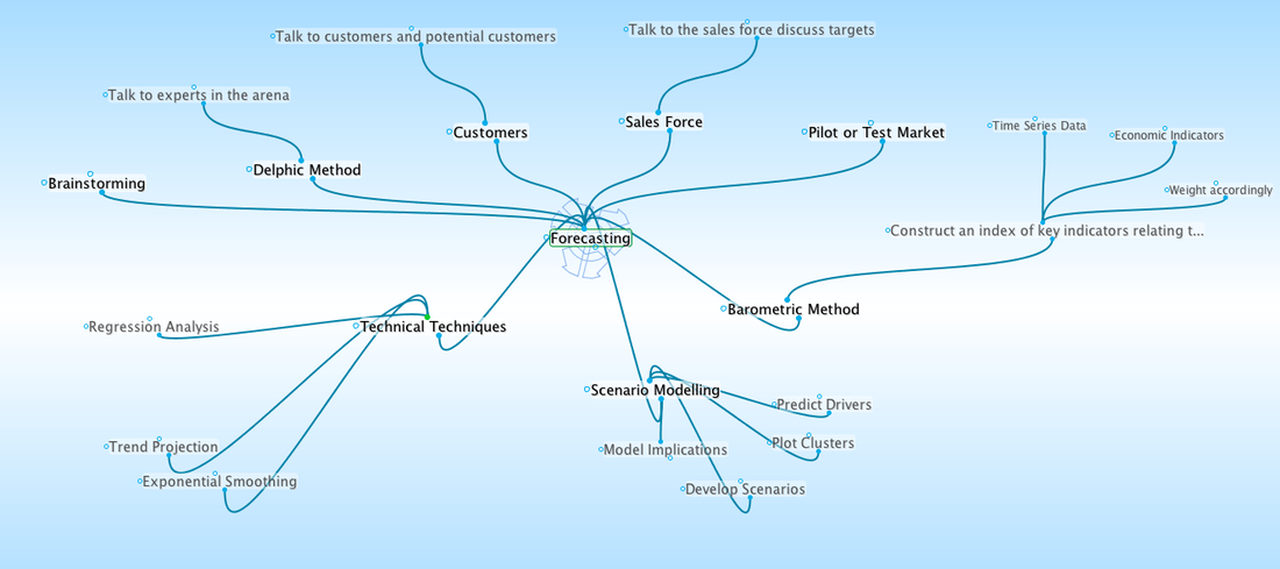
With Forecast Pro, we can create accurate forecasts quickly and easily using proven statistical forecasting methods. Research has shown that no single method works best for all data, which is why Forecast Pro provides a complete range of forecasting approaches to address all types of business needs. Forecast Pro's models accommodate seasonal demand, product hierarchies, product promotions, slow-moving items, causal variables, outliers and much more.
Expert Selection - Expert Selection takes the guesswork out of forecasting. The built-in expert system analyzes your data, selects the appropriate forecasting technique, builds the model and calculates the forecasts–it even explains its reasoning in ordinary English!
Exponential Smoothing - Twelve different Holt-Winters exponential smoothing models are provided to accommodate a wide range of data characteristics. The robustness of exponential smoothing makes it ideal when there are no leading indicators, and when the data are too short or volatile for Box–Jenkins. You can select the model and set the parameters yourself or let Forecast Pro do it automatically.
Box-Jenkins - For stable data sets, Forecast Pro supports a multiplicative seasonal Box-Jenkins model. The model can be built completely automatically or interactively using a full range of screen-oriented diagnostics.
Dynamic regression - If there are important leading indicators, use Forecast Pro XE's dynamic regression. You can include independent variables, lagged or transformed variables and build generalized Cochrane–Orcutt models. Using Forecast Pro XE's self–interpreting diagnostics, you can build and compare alternative models with a few clicks of the mouse.
Event models - Event models extend exponential smoothing by providing adjustments for special events such as promotions, strikes or other irregular occurrences. You can adjust for events of several different types such as promotions of varying sizes or types, or movable holidays like Easter and Rosh Hashanah. Event models are easy to build and adaptable to a variety of situations.
Multiple-level models - Multiple-level models allow you to aggregate data into groups that can be reconciled using a top–down or bottom-up approach to produce consistent forecasts at all levels of aggregation. Seasonal and event indexes can be extracted from the higher–level aggregates and applied to lower-level data.
New Product Forecasting - Forecast Pro XE includes several methods for forecasting new products, including forecasting by analogy, item supersession and the Bass diffusion model.
Seasonal Simplification - This is a useful technique if you are forecasting data with more than 12 observations per year. Seasonal Simplification reduces the number of seasonal indexes used to model the data and often substantially improves forecast accuracy.
Low Volume Models - Croston's intermittent demand model and discrete data models are provided to accommodate low volume and "sparse" data (i.e., data where the demand is often zero).
Curve Fitting - Curve fitting provides a quick and easy way to identify the general form of the curve which your data are following. Forecast Pro supports four types of curves–straight line, quadratic, exponential and growth (S–curve).
Simple Methods - This set of "simple" models can be extremely useful. Moving average, "same as last year," percentage growth and fixed forecast value models are included.


